MetriCup Analytics
Your coffee shop data,
finally making sense.
MetriCup connects Square POS, labor timesheets, pastry waste, and online channels into one clear dashboard so you run your cafes on numbers, not guesswork.
Live MetriCup dashboard specimen showing multi-location specialty coffee data
Operational Intelligence
The data your POS leaves behind
AI coffee operations assistant for instant shop answers
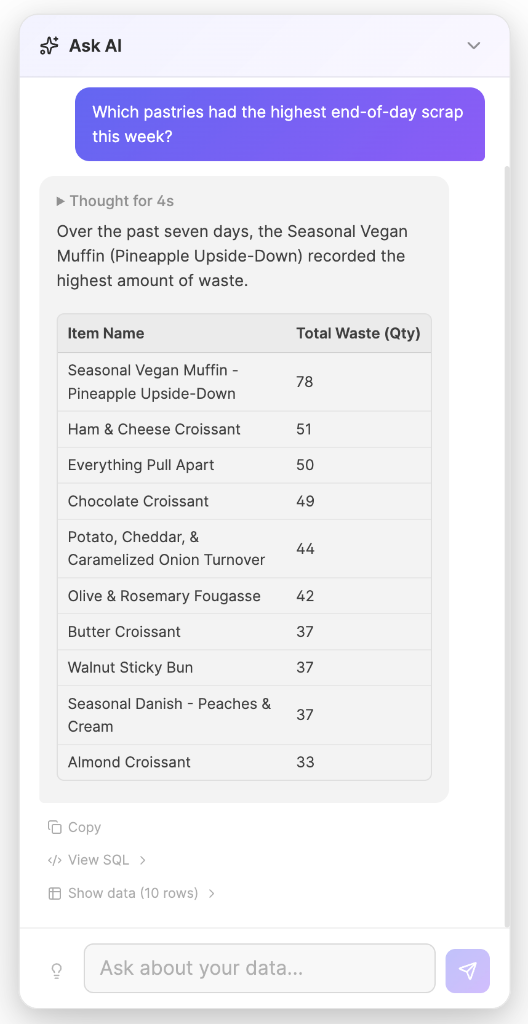
Ask plain English questions about your cafes and get immediate answers backed by your live POS, labor, and inventory data. No SQL queries, no CSV downloads, and no building custom reports.
- →Ask natural questions: 'Which pastries had the highest end-of-day scrap this week?'
- →Get itemized breakdowns: identify high-waste bakery items before placing tomorrow's vendor orders
- →Staffing & labor efficiency audits: 'How did Downtown's SPLH compare to Market Square?'
- →Inspect the data anytime with one-click SQL and raw table view options
- →Grounded exclusively in your private cloud data without training public models
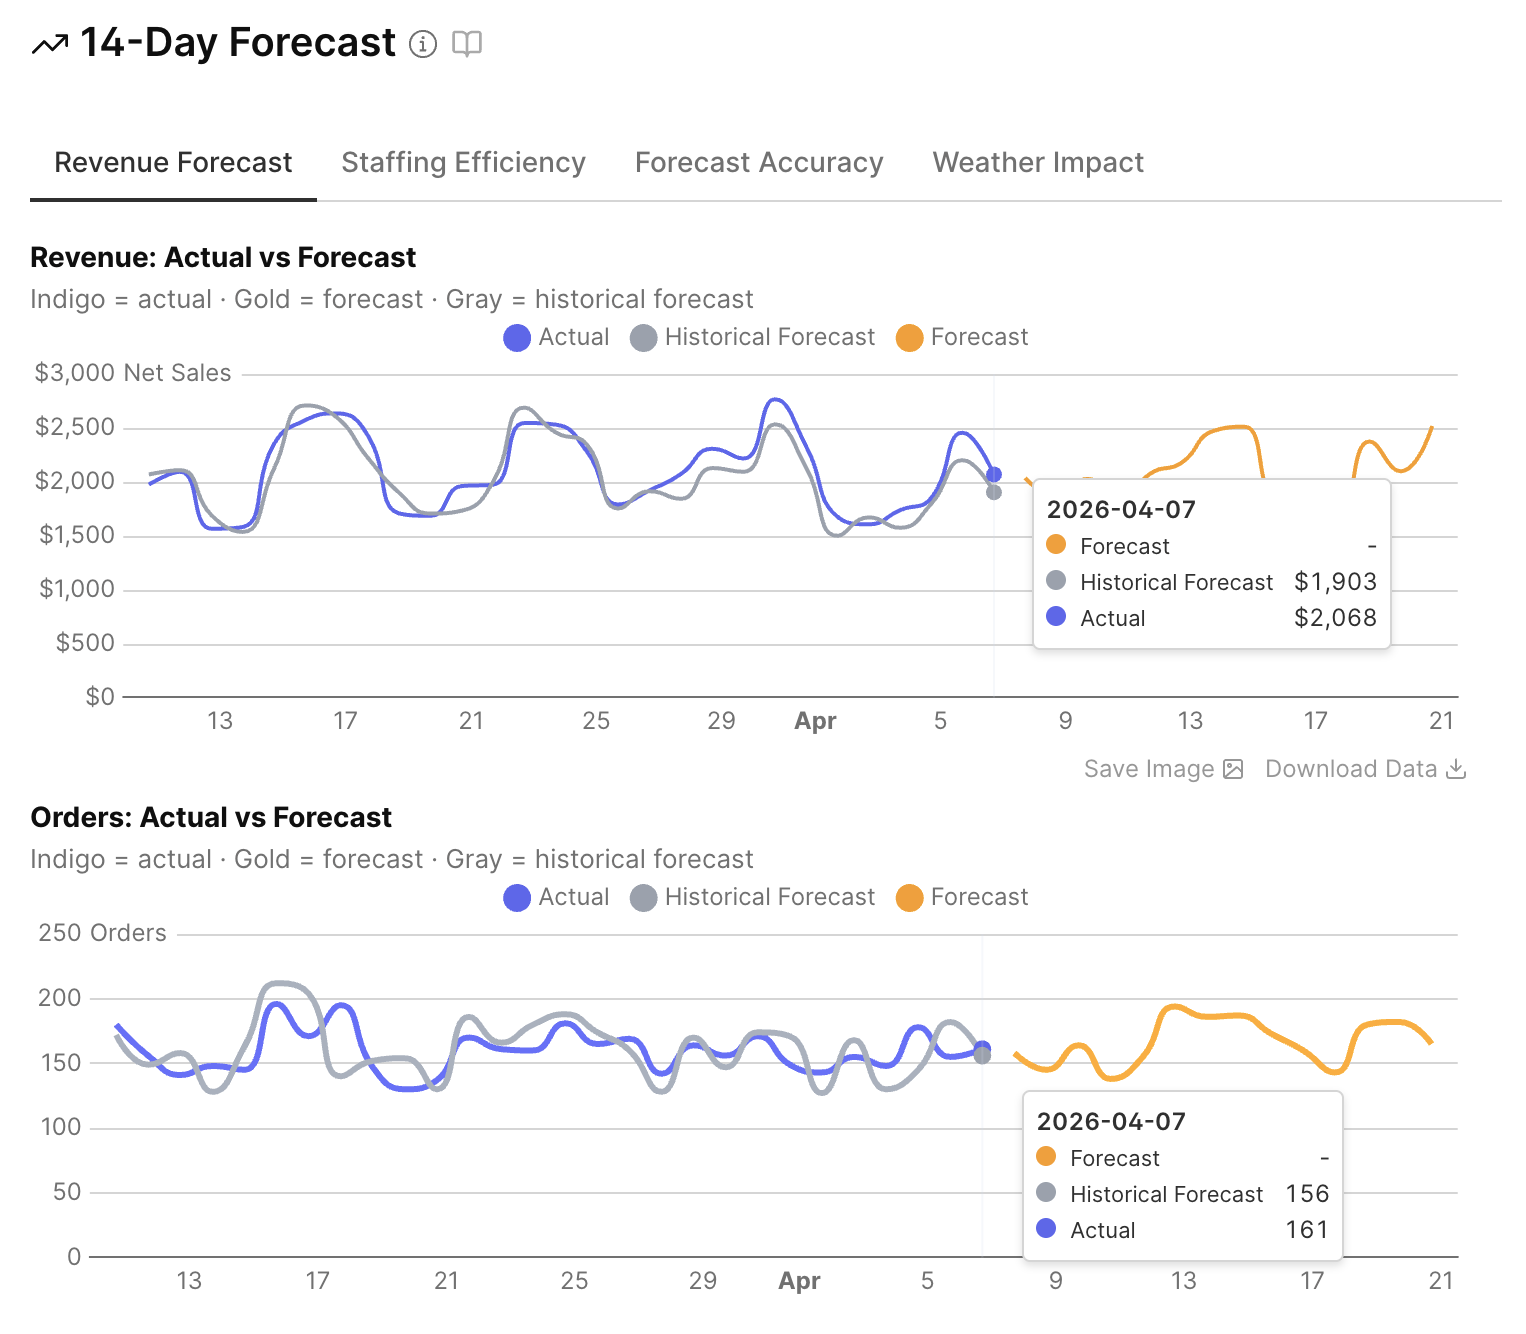
14-day demand and staffing forecasts by location
MetriCup forecasts daily revenue and order volume for the next two weeks using three inputs: a same-day-of-week baseline, per-location holiday factors, and weather corrections. That forecast generates recommended staffing hours so managers schedule to demand rather than habit.
- →Baseline calculated from the median of the last 4 non-holiday matching weekdays
- →Per-location holiday adjustments (Downtown loses 81% on Presidents Day, Market Square gains 34%)
- →Weather sensitivity calibrated per store for walk-up windows versus indoor seating
- →Recommended labor hours calculated directly from predicted sales and target SPLH
- →Post-shift staffing accuracy scores to refine future schedules
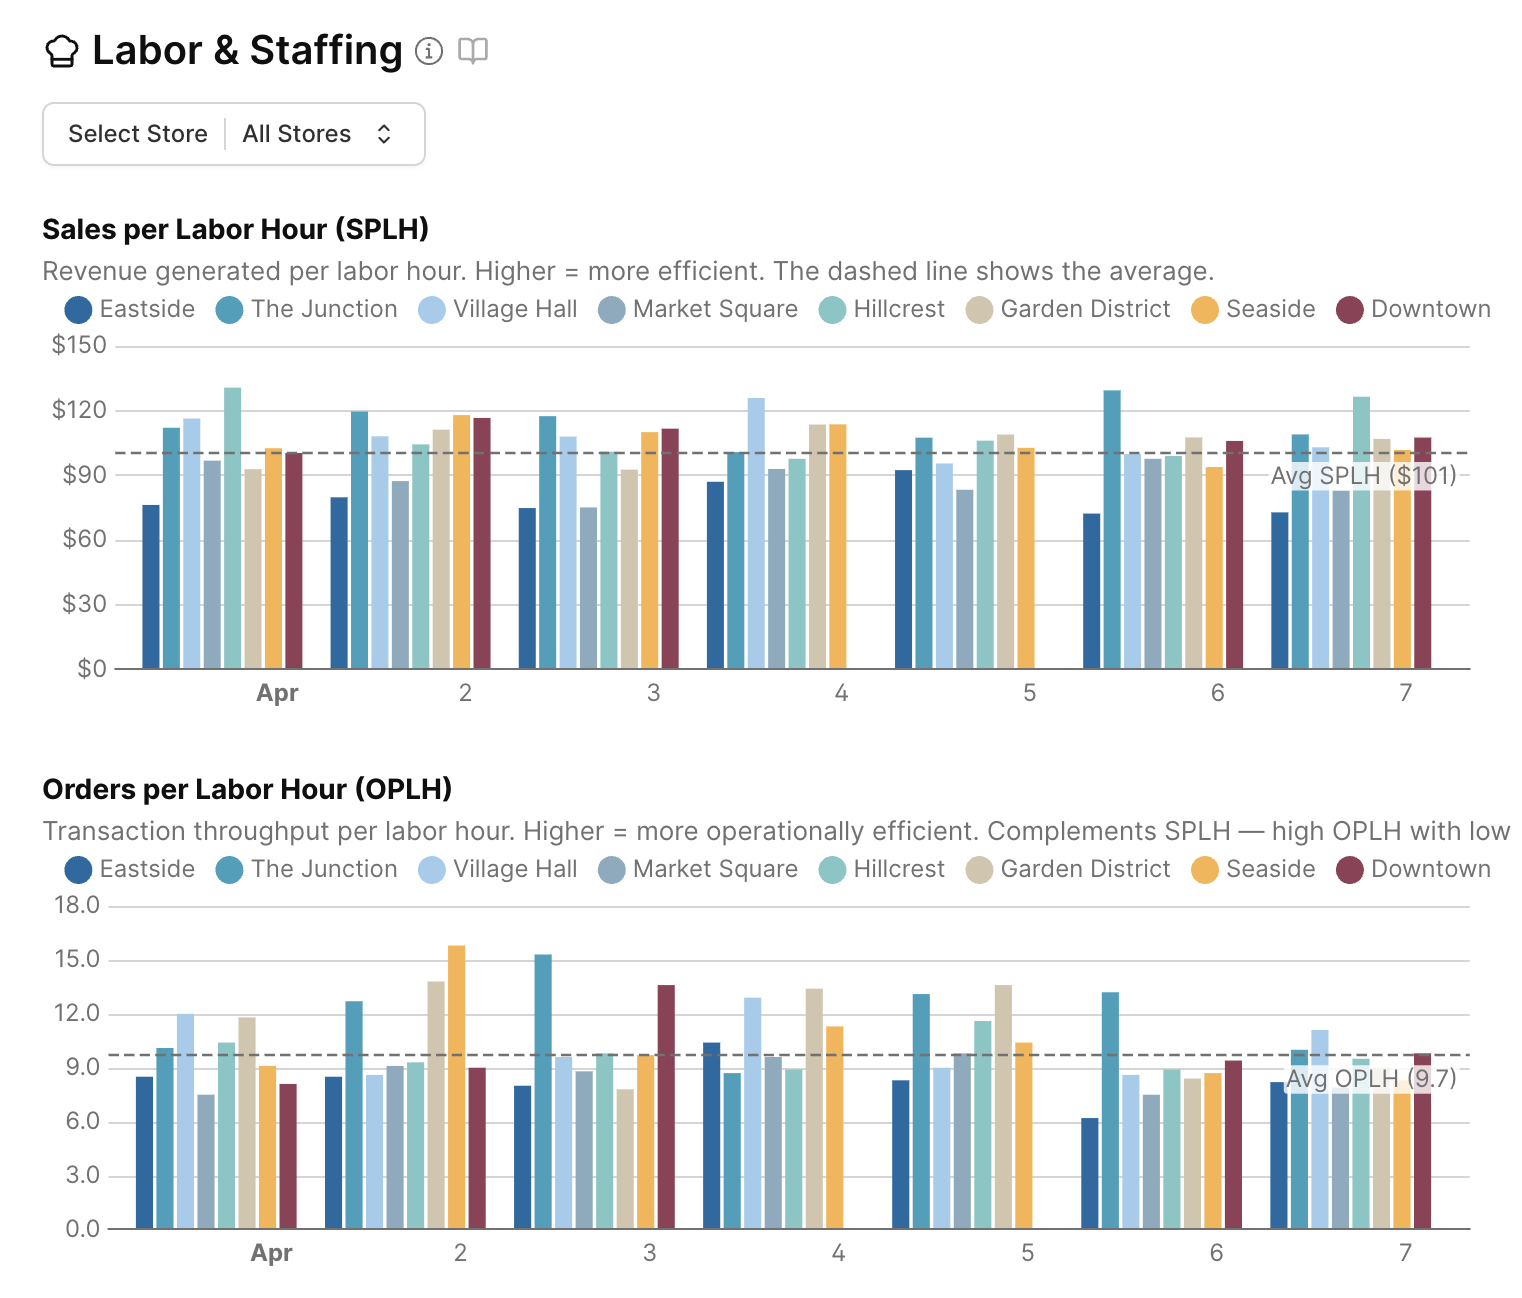
Labor efficiency you can manage on the floor
Beverage-focused cafes typically target $90 to $125 in sales per labor hour. Kitchen cafes run lower. MetriCup tracks your SPLH and OPLH by location and day so you benchmark against your own historical baseline rather than generic averages.
- →SPLH (Sales Per Labor Hour) measures revenue generated per hour worked
- →OPLH (Orders Per Labor Hour) isolates speed from ticket size
- →California meal break compliance audits to prevent 5:01 premium pay penalties
- →OPLH versus tip percentage tracking to pinpoint where speed hurts hospitality
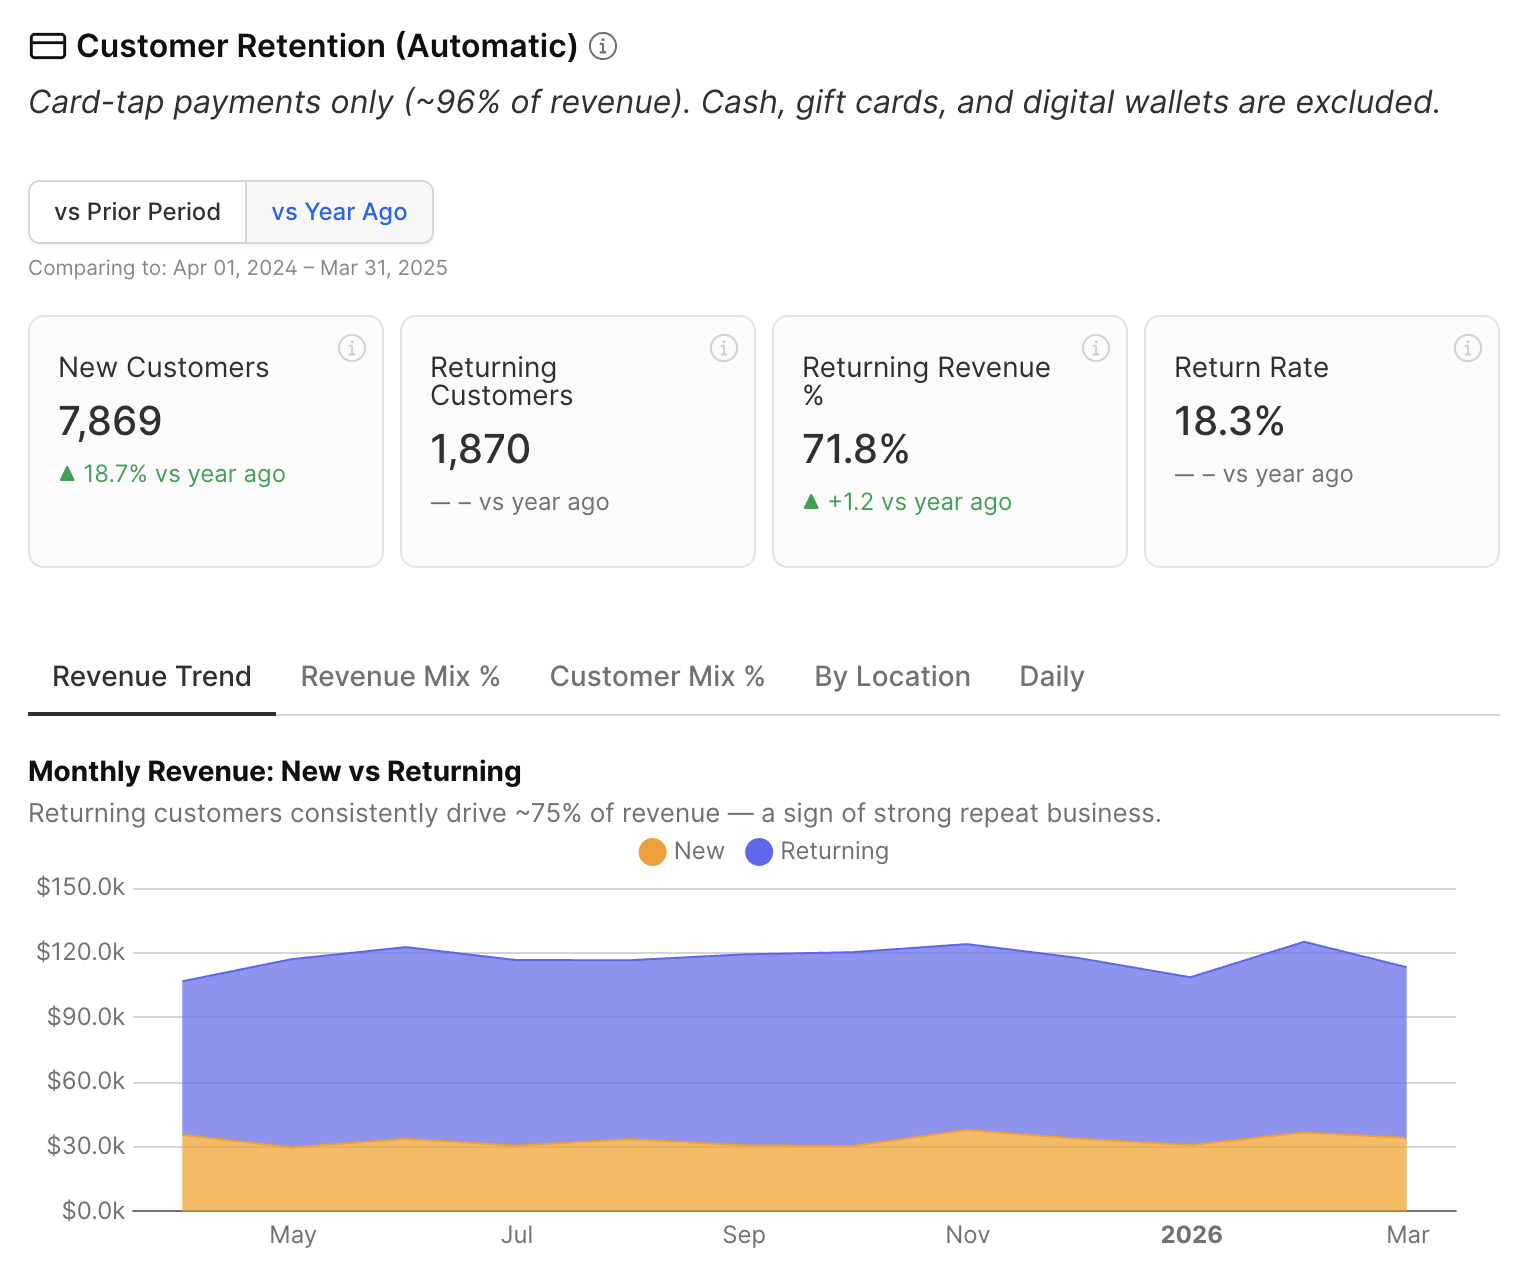
Customer retention without a mobile loyalty app
MetriCup classifies card-tap transactions (representing 96% of cafe revenue) as New or Returning using encrypted card fingerprints. You measure regular customer retention without asking customers to download an app.
- →New versus returning regular revenue split across all locations
- →Average order value (AOV) and return visit frequency
- →Repeat customer revenue share target (75% benchmark)
- →Monthly regular customer acquisition trends
Customer satisfaction connected to labor efficiency
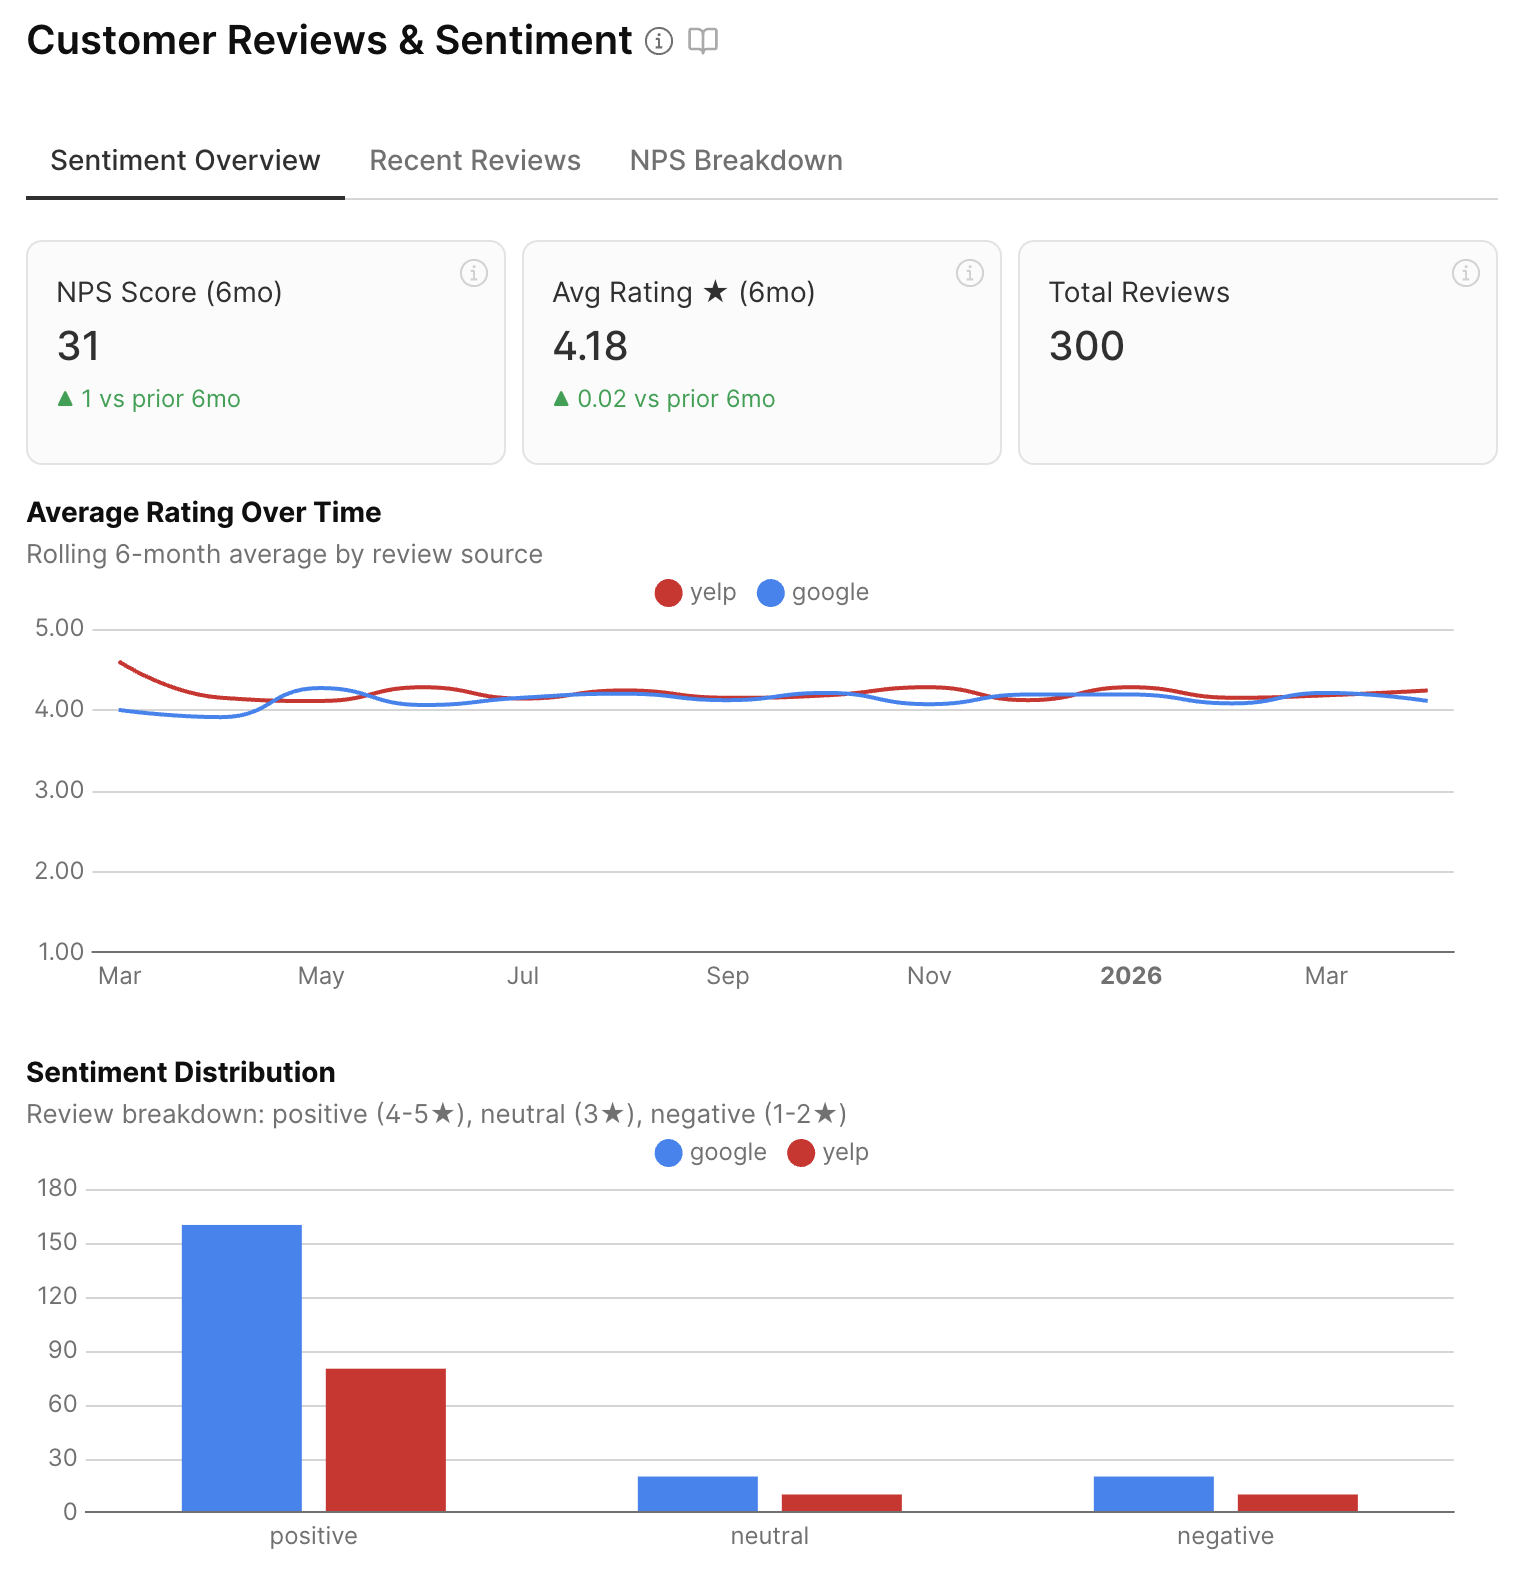
MetriCup imports Google and Yelp reviews alongside your SPLH and staffing data, revealing whether lean shifts help profit or hurt customer reviews.
- →NPS trends and Google and Yelp star ratings over time
- →Sentiment distribution across positive, neutral, and negative feedback
- →Review sentiment mapped against hourly SPLH to detect understaffing
- →Rolling 6-month trends to filter out single-day noise
Sales intelligence across every location and channel
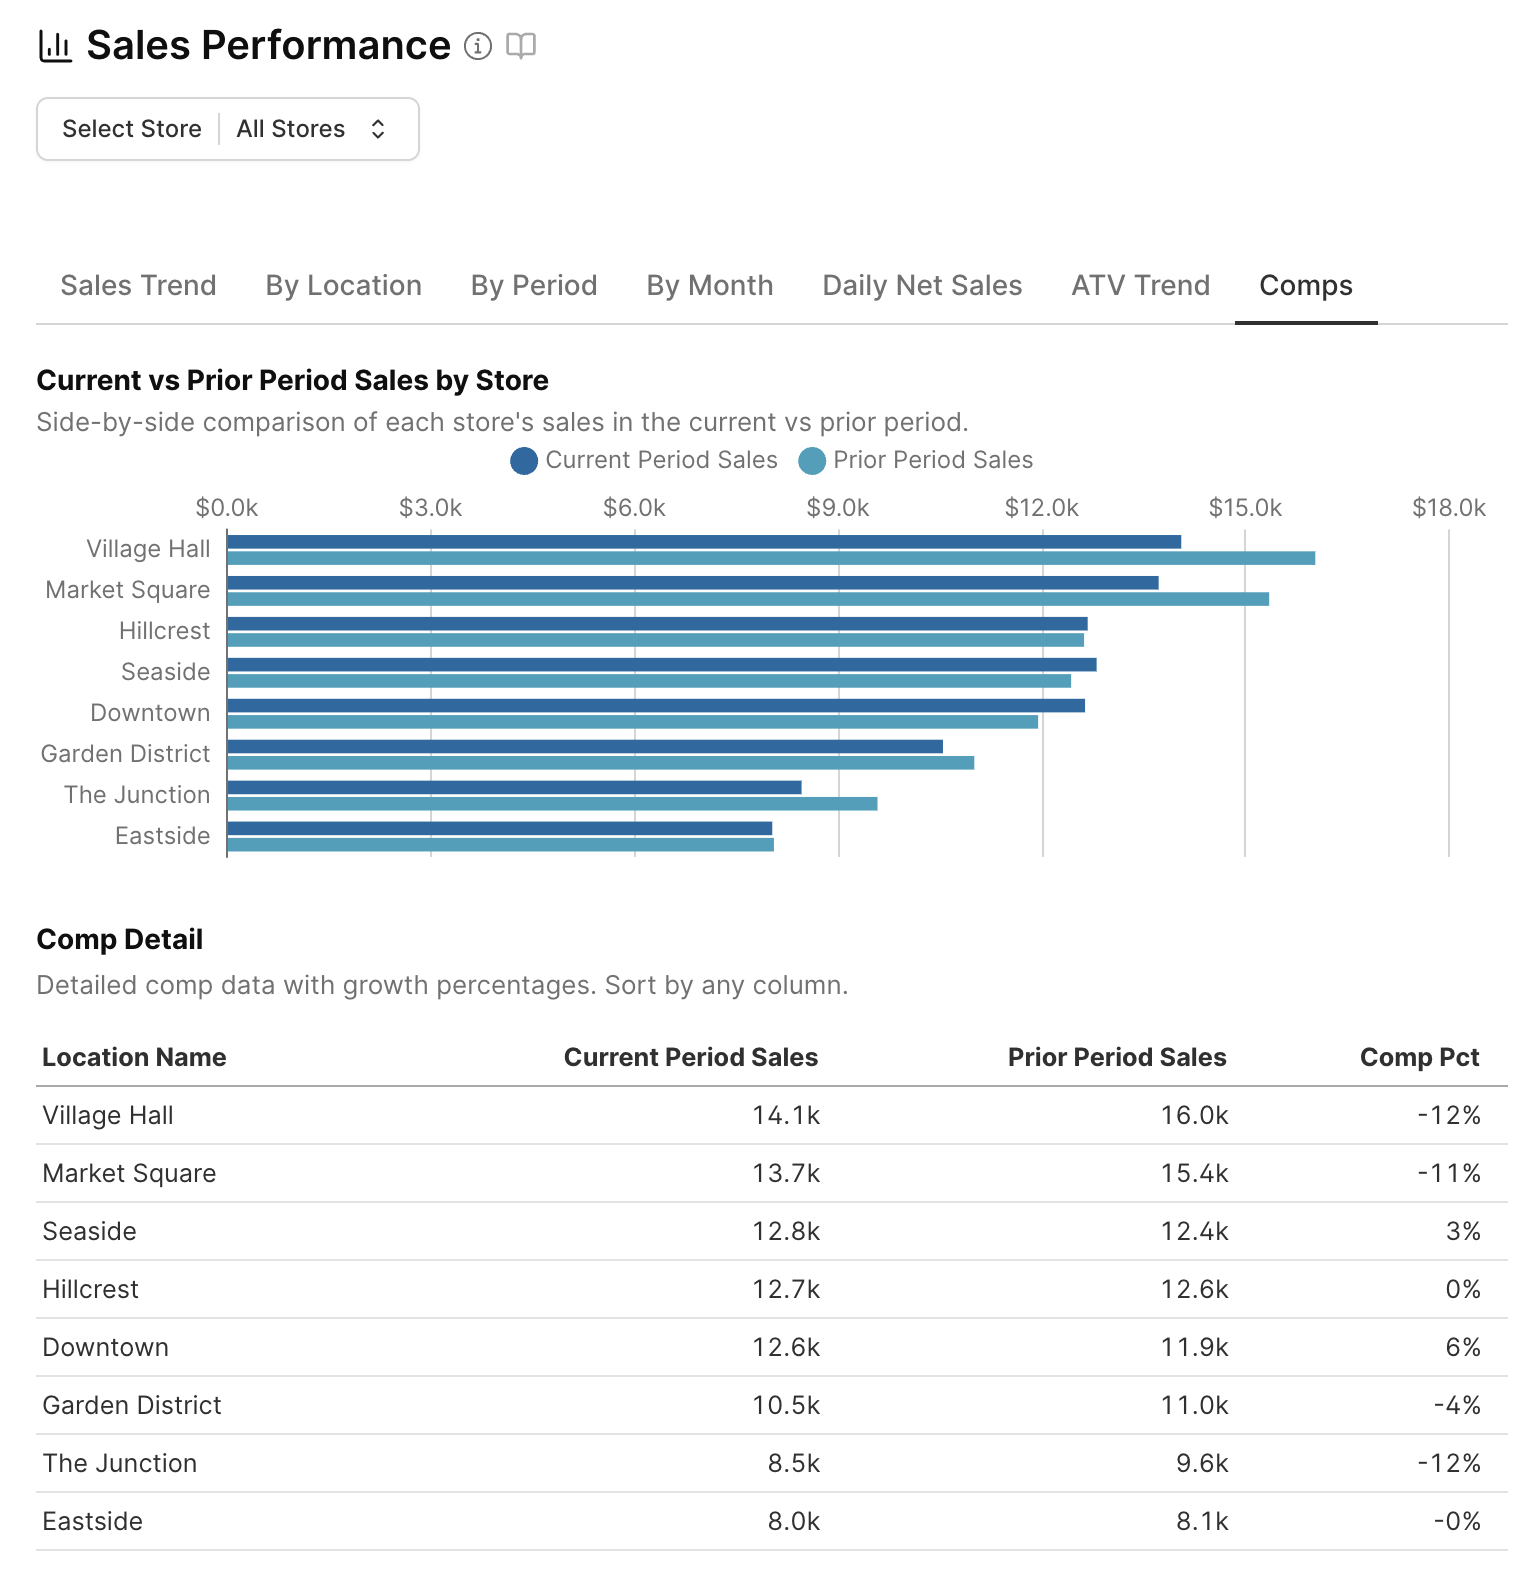
Review net sales, transaction volume, same-store comps, and channel mix in one view. Compare locations side by side and audit margin leaks immediately.
- →Same-store comps across period-over-period and year-over-year timelines
- →Revenue breakdown across in-store counter, Square Online, and DoorDash
- →Weekly retail bean bag velocity tracking by cafe shelf
- →Tipping by channel (DoorDash averages 0.4%, in-store averages 12.4%)
Operator Knowledge Base
Deep dives on coffee data & unit economics
Channel Economics
The Multi-Channel Margin Trap
How 25% delivery commission rakes and 0.4% tip averages erode cafe profitability and barista retention.
Labor Compliance
The 5:01 Problem in California
Why POS timeclocks miss 5th-hour meal violations and how to audit timesheets before payroll runs.
Bakery Scrap
The Pastry Dilemma
Why selling out of croissants at 10:30 AM burns sales, and how to calibrate inventory orders.
Ready to see your data?
MetriCup is in active early access. Drop your info and we will connect your POS and labor accounts for a live audit.
Get early access