MetriCup Guide
Are You Growing Your Coffee Shop or Just Getting Lucky?
 Rich Manalang
Revenue increases look encouraging on weekly charts. But they do not tell you whether you are building long-term equity or cycling through first-time visitors.
Two very different growth patterns
Coffee shop revenue grows in two ways: you attract first-time customers, or your existing regulars visit more frequently and order larger tickets. Both look identical on top-line revenue charts, but only repeat visits build sustainable value without continuous marketing expense.
A cafe where 75% of revenue comes from returning regulars has built durable habit. A cafe where 75% of revenue relies on new foot traffic must replace its customer base constantly, meaning revenue drops the moment tourist or passerby foot traffic slows down.
The 75% returning customer benchmark
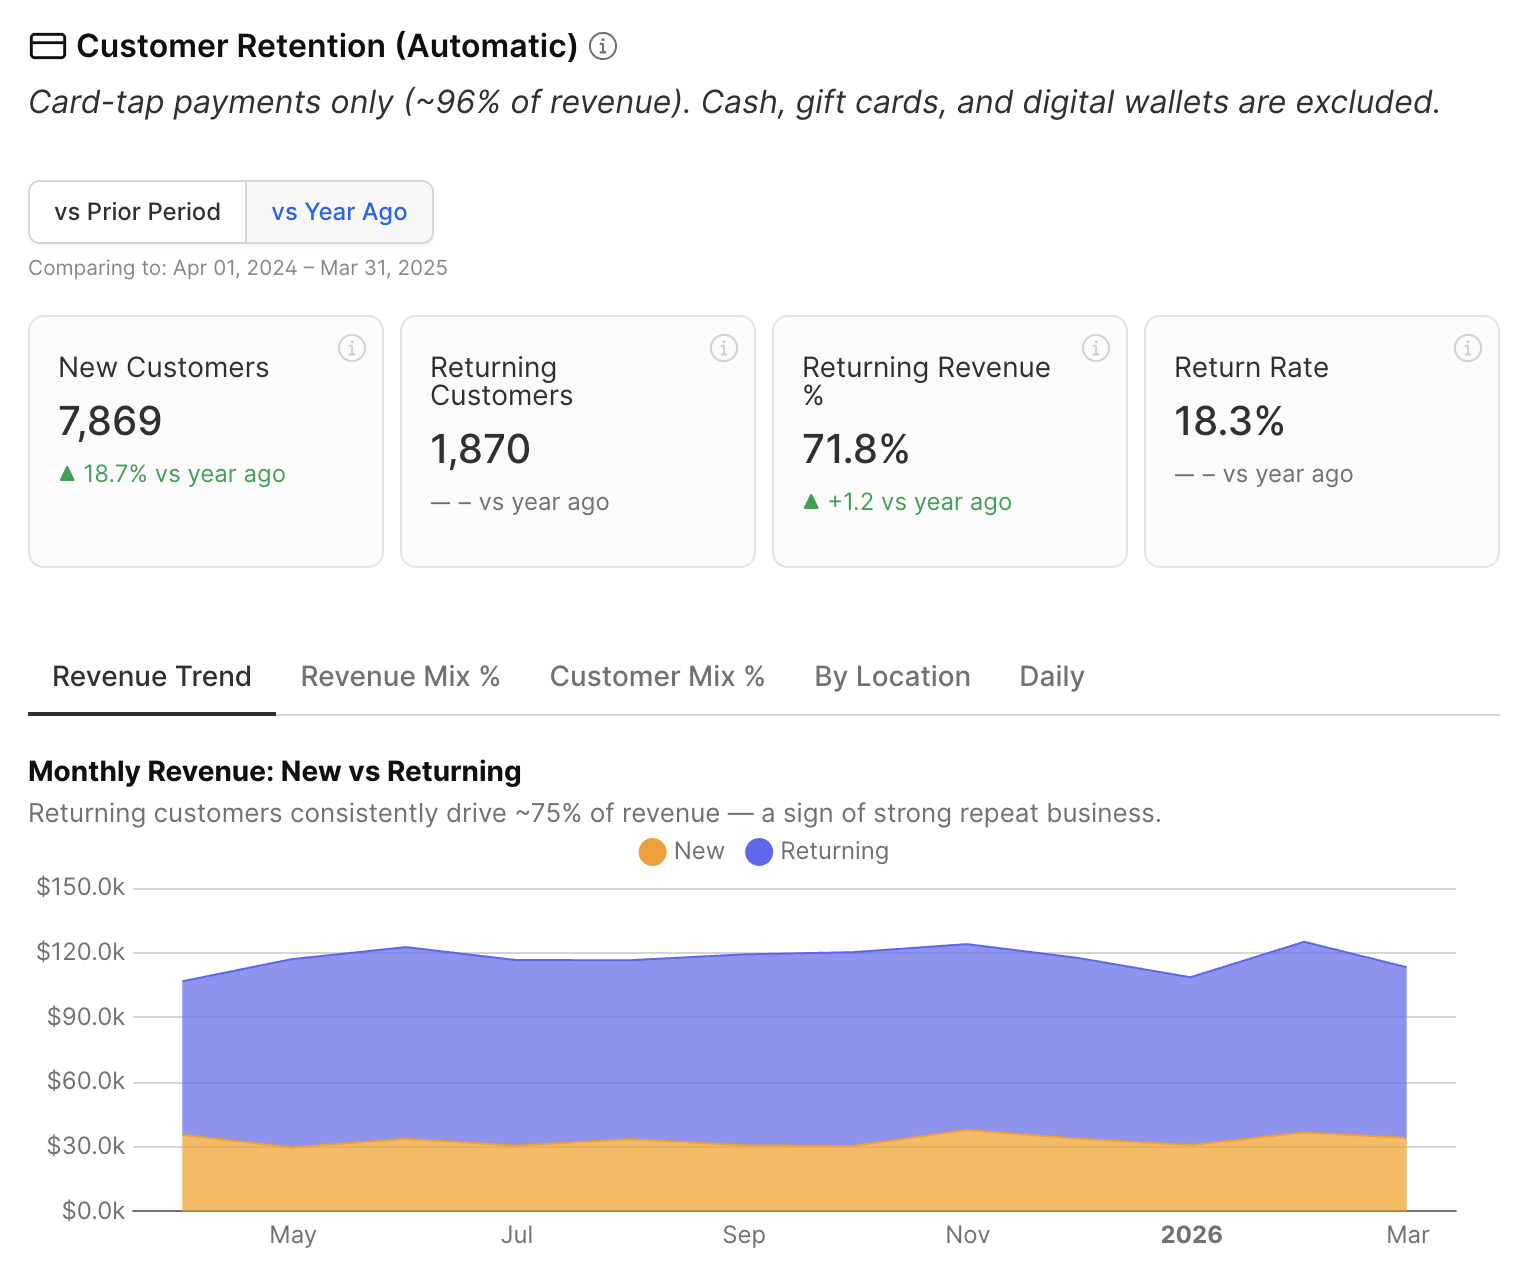
Established specialty coffee shops typically see returning regulars account for roughly 75% of total revenue. While brand-new locations start lower as they establish local awareness, established cafes should target this ratio.
If returning regular revenue sits far below 75% after your first year, you have an operational retention bottleneck: customers try your espresso once and choose not to return.
Tracking retention through card fingerprinting
You do not need a custom mobile app or punch cards to measure retention. Approximately 96% of specialty cafe sales process through credit or debit cards. Every payment card generates an encrypted unique fingerprint in your POS data.
By tracking tokenized card fingerprints over time, you can classify each card tap as New or Returning without customer friction.
This provides exact clarity on active customer volume, visit frequency, and the exact revenue share generated by repeat guests.
What retention signals reveal
Returning regular revenue share is declining
You are losing regulars or failing to convert new guests. Examine operational changes: barista turnover, drink consistency, price increases, or new competition nearby.
New customer count grows while returning share stalls
Your location or marketing attracts discovery, but service or quality fails to retain visitors. Fixing cafe floor execution costs less than buying more promotional foot traffic.
Both new and returning visit counts expand
Healthy compounding growth. New visitors convert into repeat regulars without requiring promotional discounts.
Why loyalty apps do not solve retention on their own
A loyalty program provides rewards, but it cannot fix underlying operational flaws. If drinks take 14 minutes during the morning rush or espresso extraction is sour, offering points will not bring customers back.
Measure your baseline retention with clean card-tap data first. Once your floor delivers consistent product quality and speed, loyalty initiatives can accelerate natural repeat visits.
MetriCup
See your new vs. returning split automatically
MetriCup uses card fingerprinting to classify transactions across all your locations, tracking returning revenue share and frequency without an app download.
Get early accessRelated Operator Guides
View All Guides →The Multi-Channel Margin Trap: When Delivery Apps Cannibalize Barista Tips
Delivery apps take a 25% commission rake and average 0.4% tips compared to 12.4% in-store.
Why Your Store Managers Never Look at BI Dashboards (and Why 6:00 AM Email Briefs Work)
Automated 6:00 AM email digests give opening shift leads actionable numbers before doors unlock.