MetriCup Guide
Why Your Coffee Shop's Busiest Days Aren't Always Your Most Profitable
 Rich Manalang
Saturday is probably your busiest day. But is it your best day? The answer depends on which numbers you review.
Volume and profitability are not the same thing
A crowded Saturday morning with a line out the door feels like success. But if your team processes 200 orders of $5 drip coffee, you run your highest-labor day for thin margins. A quieter Tuesday with a wholesale bean order and a steady lunch rush might generate far more revenue per labor hour with half the operational stress.
Most coffee shop owners track gross sales. Fewer track how efficiently those sales were generated relative to payroll hours worked.
Two metrics that tell the real story
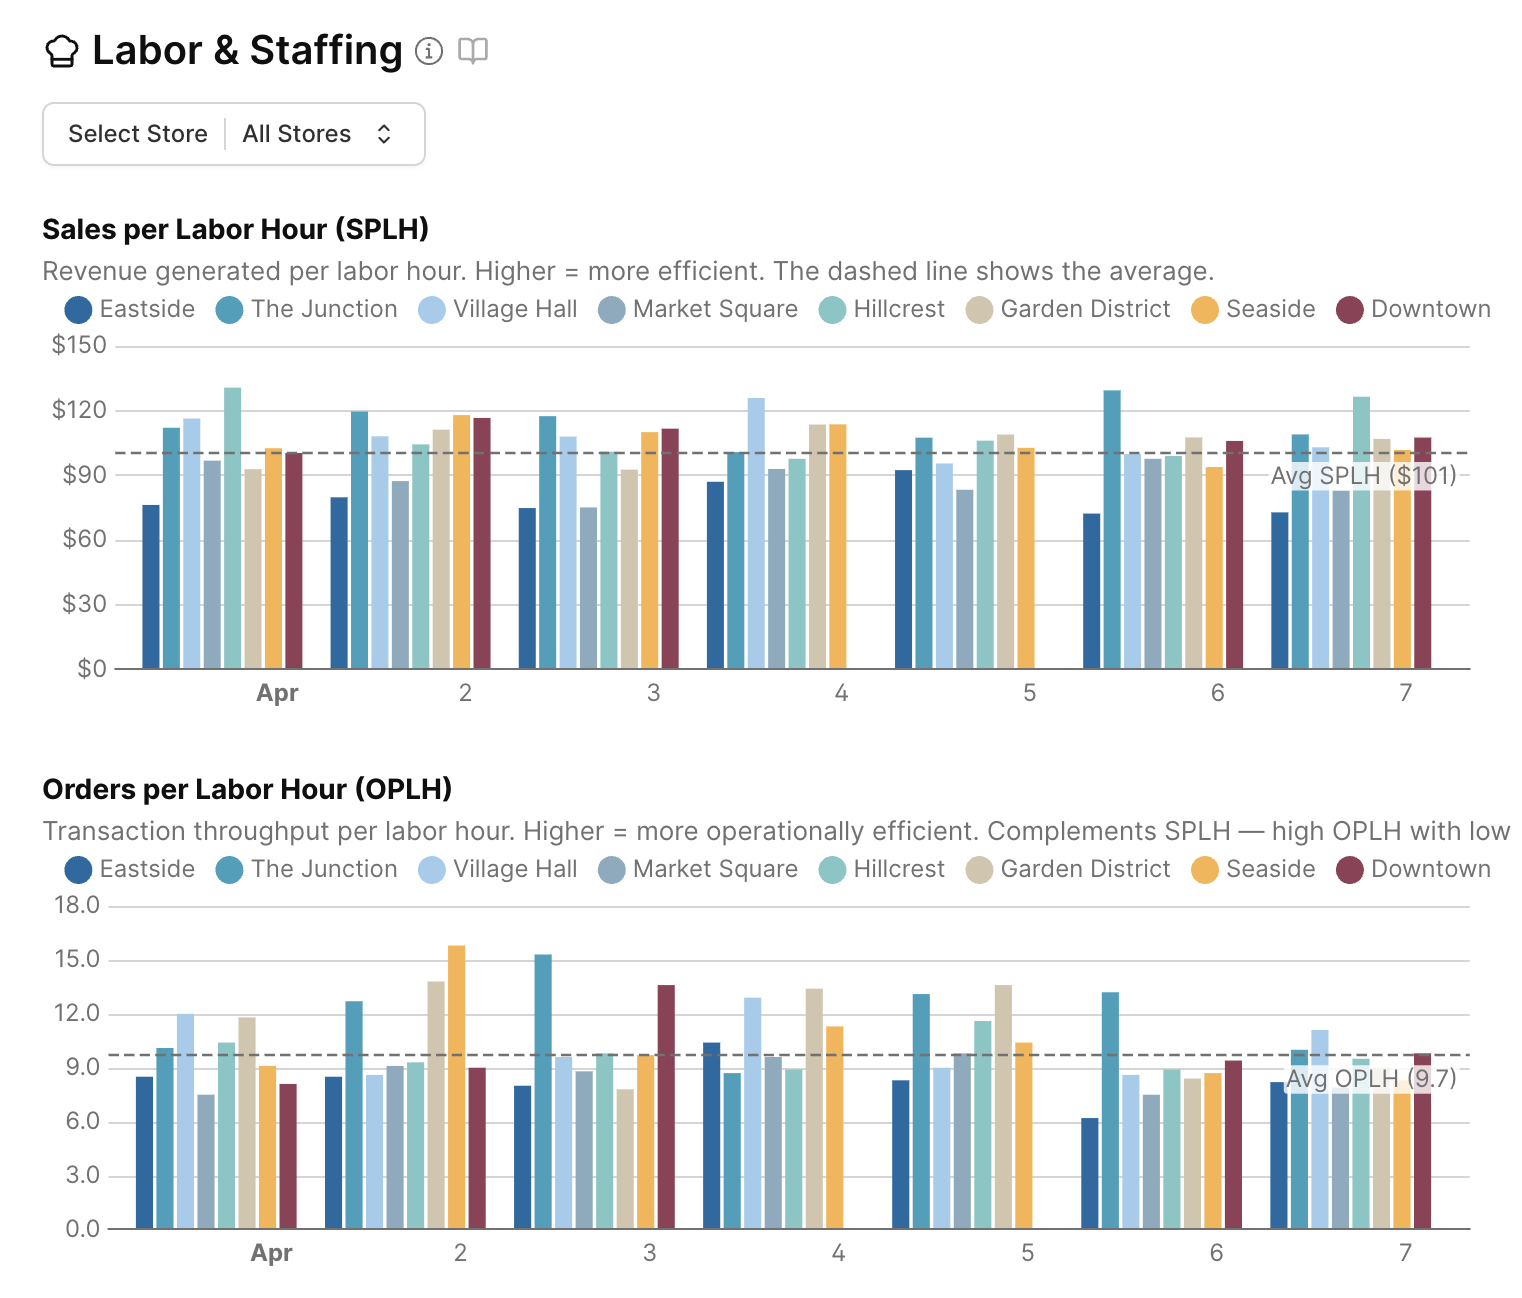
SPLH (Sales Per Labor Hour) measures how much revenue your team produces for every hour worked. A higher SPLH means your team generates more revenue relative to staffing costs.
OPLH (Orders Per Labor Hour) measures transaction throughput, showing how many tickets your team completes per hour. It separates speed from ticket size.
Together, they reveal the true operational health of your floor.
What the combinations reveal
High OPLH, low SPLH: lots of small tickets
Your team moves fast and processes high transaction volume, but average ticket size is low. Customers grab drip coffee without pastries or retail beans. The floor runs efficiently, but average ticket size drags revenue down.
High SPLH, low OPLH: fewer but larger tickets
Revenue per hour is high even though foot traffic is lighter. This indicates higher retail bag sales, catering boxes, or espresso orders paired with kitchen food.
High OPLH, high SPLH: your most efficient shifts
Strong customer traffic combined with solid average ticket size. Your team is efficient, and order combinations are healthy.
Low OPLH, low SPLH: overstaffed shifts
Slow foot traffic and small orders. These shifts indicate excess labor on the floor. The fix is scheduling fewer hours on slow weekday afternoons rather than cutting staff on morning rushes.
The throughput ceiling
When OPLH climbs too high, tip percentages drop. Your team pushes orders out faster than quality allows. Drinks are rushed, customer connections get lost, and line speed feels impersonal. Customers notice and tip less.
Every cafe has a throughput ceiling. Finding yours shows exactly when scheduling an extra barista on bar pays for itself in customer retention.
How to evaluate your shifts
Pull your sales data from Square and your actual hours worked from your timesheets. Calculate SPLH and OPLH for each day over the past 30 days. Rank shifts by SPLH rather than gross dollars.
Your most profitable days often turn out to be steady mid-week shifts where staffing matched demand and customers lingered.
MetriCup
See SPLH and OPLH for every store, every day
MetriCup connects Square POS and labor timecards to highlight which days generate the most profit per hour worked.
Get early accessRelated Operator Guides
View All Guides →The Multi-Channel Margin Trap: When Delivery Apps Cannibalize Barista Tips
Delivery apps take a 25% commission rake and average 0.4% tips compared to 12.4% in-store.
Why Your Store Managers Never Look at BI Dashboards (and Why 6:00 AM Email Briefs Work)
Automated 6:00 AM email digests give opening shift leads actionable numbers before doors unlock.